

Online spend in November 2021 was $893 million, a very impressive 40% rise on November last year and 77% up on two years ago. With an average of 260,000 transactions and nearly $30 million spent online each day, November is the biggest online spending month we’ve seen since we started looking at the data, over 4 years ago.
November 2021 (compared to November 2020)
$893mOnline Spend |
$4.7bPhysical Store Spend |
16%Online share of retail spend |
With the reopening of Auckland’s stores in the second week, expectations were high for a big month for offline spending as well, however in-store spending was down slightly on November last year. The fact that a similar spend level was achieved with fewer shopping days suggests strong trading. The month’s in-store spending was up 7% on pre-covid levels of November 2019.
Both online and offline shopping was available to Kiwis for most of November. As a result, we saw online shopping settle back to 16% of total retail spend, down from last month’s 17.2%. This drop was to be expected with Auckland retail stores reopening under some restrictions. What makes this 16% number most telling is how it compares to pre-lockdowns levels of around 10-12% when both options were also open to all New Zealanders. It may be too early to tell but early indications are that many Kiwis are choosing to keep shopping online even when the stores are open.
While Aucklanders led the way in spending growth with 58%, they weren’t the only ones spending up this November. Almost all regions experienced growth of more than 20% compared to last year. Gisborne (up 39%) and Northland (up 38%) were both areas with Covid scares in November and this may have contributed to their higher online spending growth.
Where did all this online spending go in November? Everywhere, actually. All sectors saw significant – 25% plus – growth on their November 2020 numbers. Clothing and Footwear was the big winner, up 60% compared to November 2020 and double the same month in 2019. Department, Variety and Misc. Retail was also up an impressive 42% compared to November last year. These two sectors made up 54% of all online spend this November.
Another good sign for local retailers was the continuation of the ‘buy local’ trend. 72% of all online spend was domestic, up from 70% last year. Having said that, overseas retailers had one of their best months in years, with international online spend also up compared to last year, driven by Kiwis chasing Sales Day deals with big global online players.
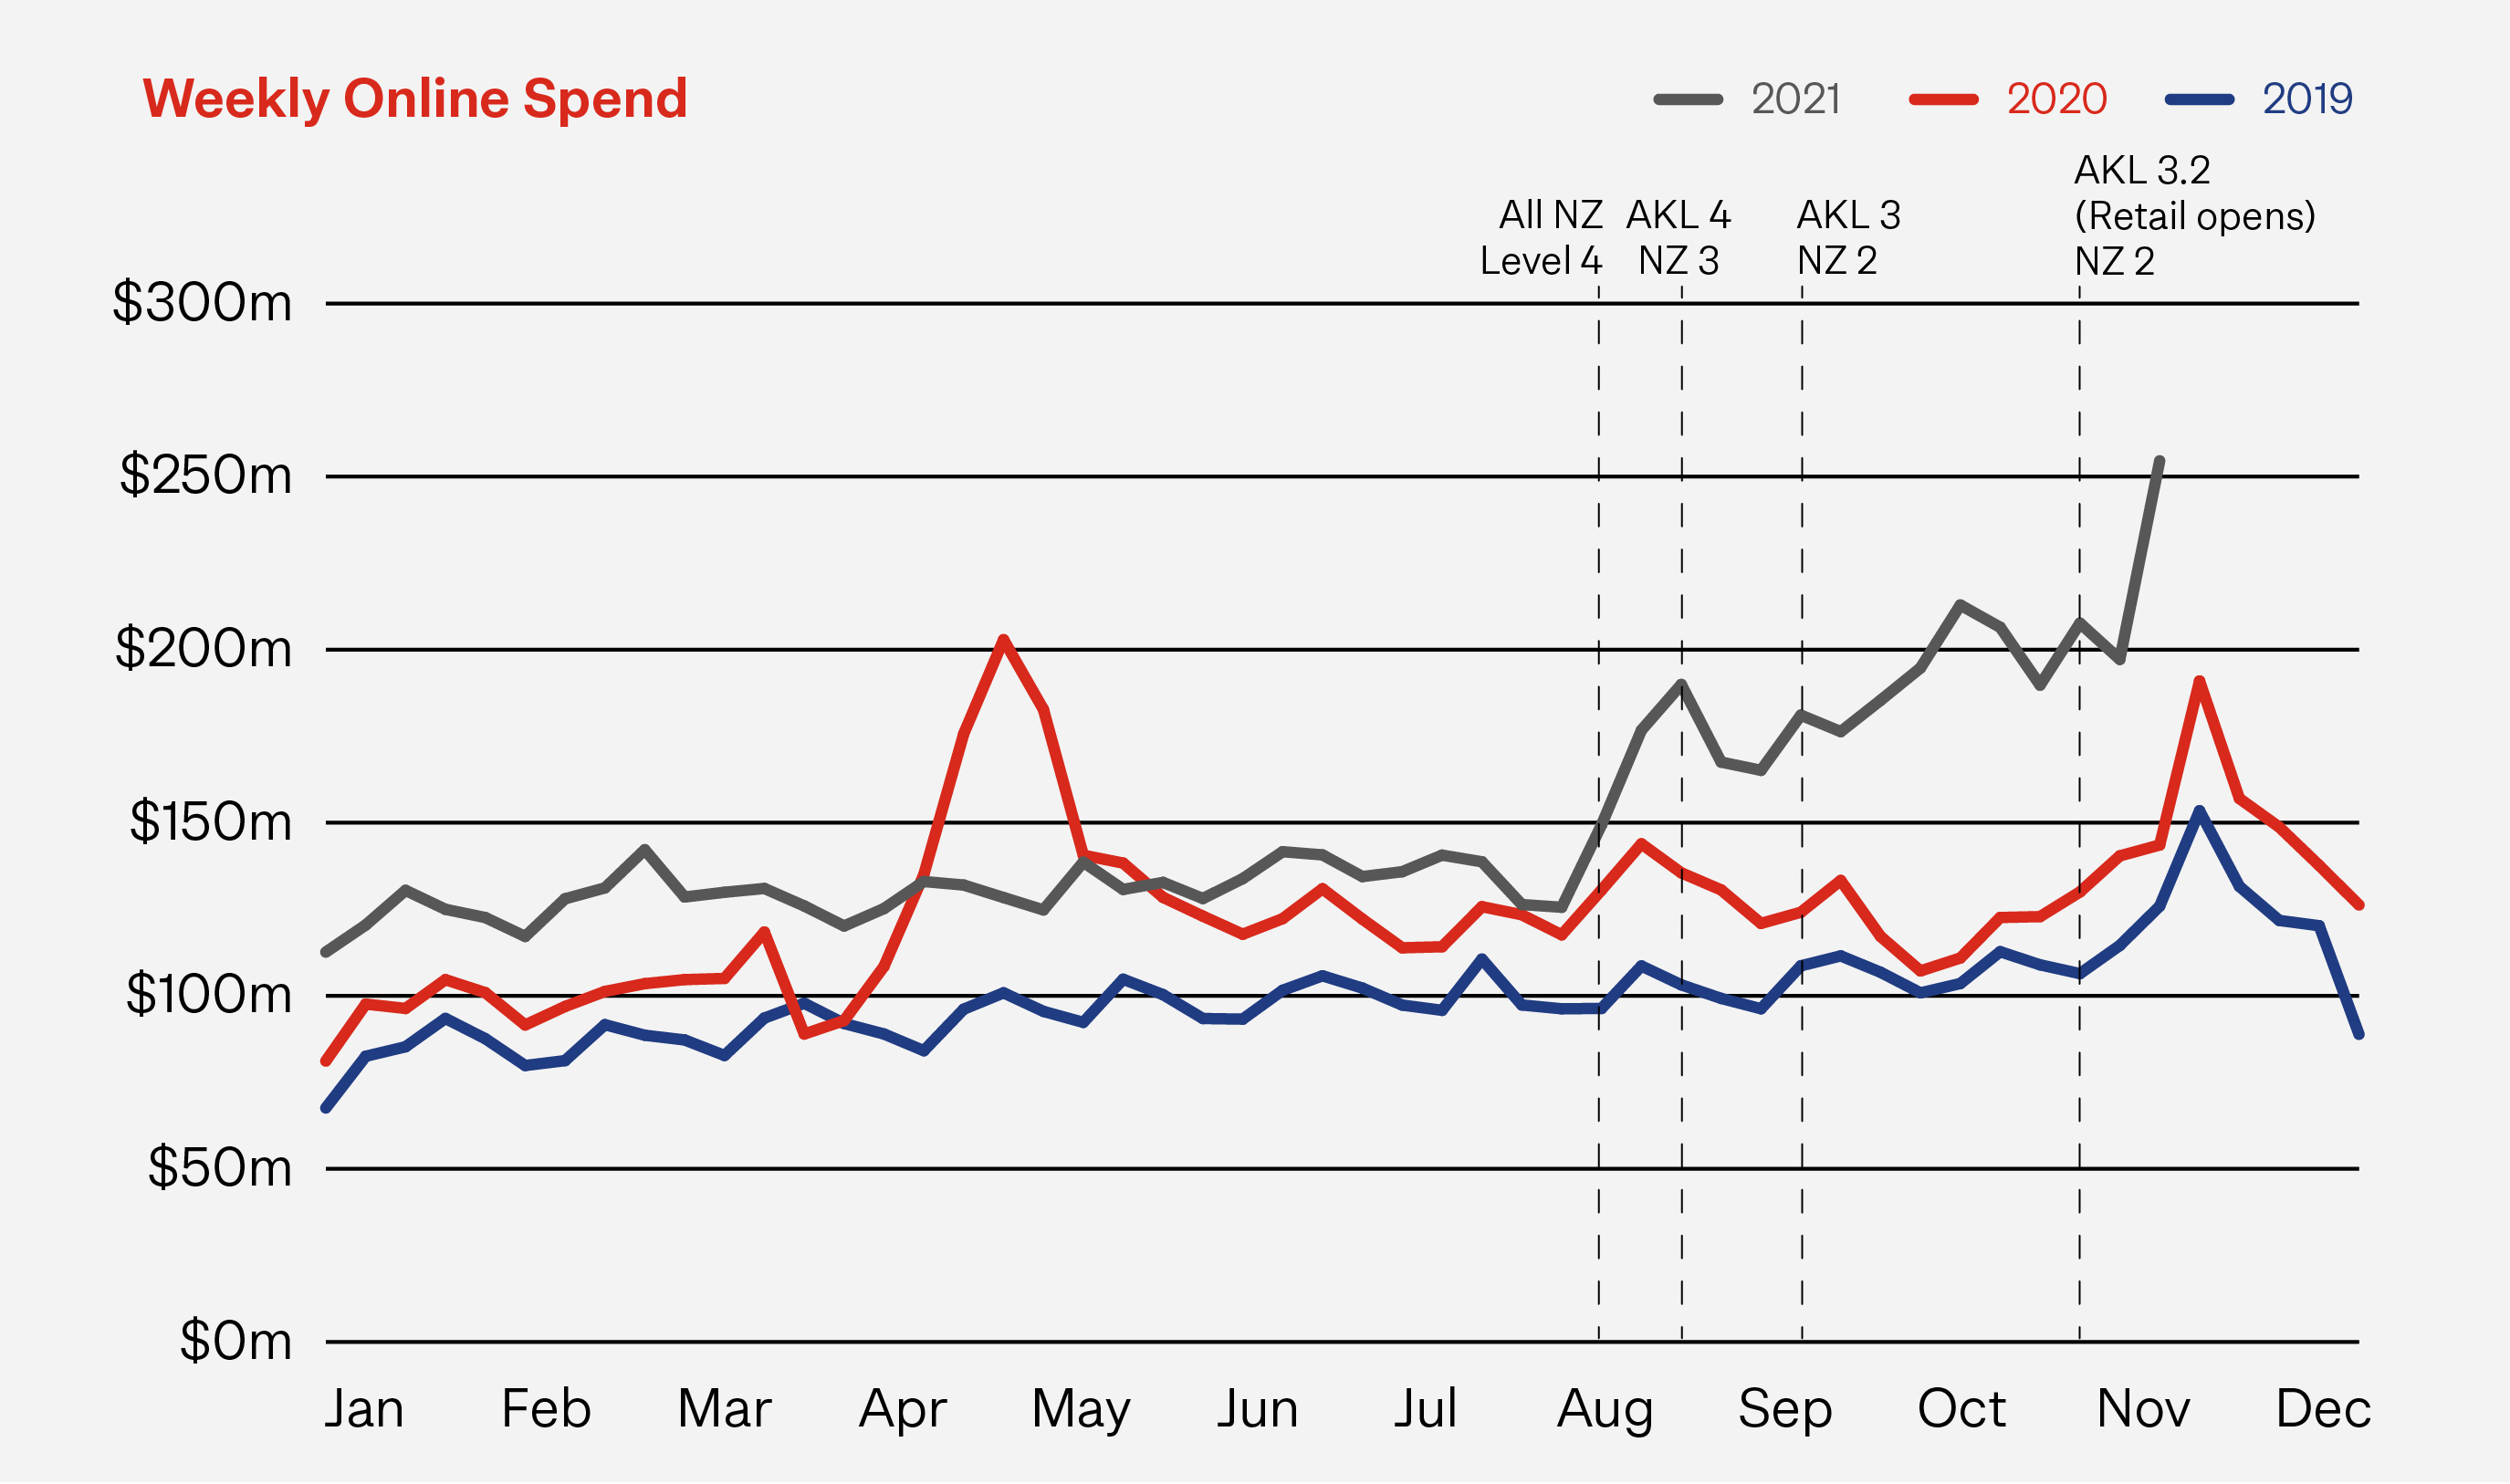
2021’s year to date online spend is now 21% higher than where it was at the same time last year and 52% higher than the same point two years ago. With overall retail spend (online + offline) up a more modest 3% for the period, there can be little doubt that a second year of lockdowns has driven online shopping to yet another level this year.
Key drivers of online spend
- 7.8 million online transactions
Up 42% compared to November 2020 and up 62% compared to two years ago.
- $114 Average basket size
Down $2 compared to November last year but $10 above November 2019 levels.
- 1.57 million shoppers
14% more people shopping online compared to November last year and over 300,000 more shoppers than two years ago.
Combining these three key drivers, we see that the average online shopper made 5 transactions during the month, up from 4 a year ago. This is the second month in a row where shoppers averaged more than one online purchase a week. The average online spend per shopper for the month was $568, up 23% on a year ago and the highest average monthly spend we’ve seen in the last few years.
The big sales days
Probably the biggest driver of spend growth in November was the big sales days, Singles’ Day (11/11), Black Friday (26/11), and Cyber Monday (29/11). After a tough year, and even despite some supply and logistic challenges, most retailers embraced the global sales event phenomena, with each sales day reaching a new high.
Online spend (compared to the same day 2020)
$30.8mSINGLES DAY |
$39.8mBLACK FRIDAY |
$39.5mCYBER MONDAY |
In recent years, we’ve seen a growing trend where the sale day promotions progressively start earlier and last longer. This trend was particularly exaggerated this year with the debut of a new sales event and many retailers seemingly offering a whole month of deals. As a result, we saw the month’s sales highs on days other than the designated event days. The first peak was the day before Singles’ Day, most probably driven by ‘Click Frenzy’ which kicked off on 9 December. This popular Australian online shopping event launched in New Zealand for the first time this year and looks like it has already outperformed Singles’ Day. It certainly is an online event that Kiwi online retailers need to watch out for.
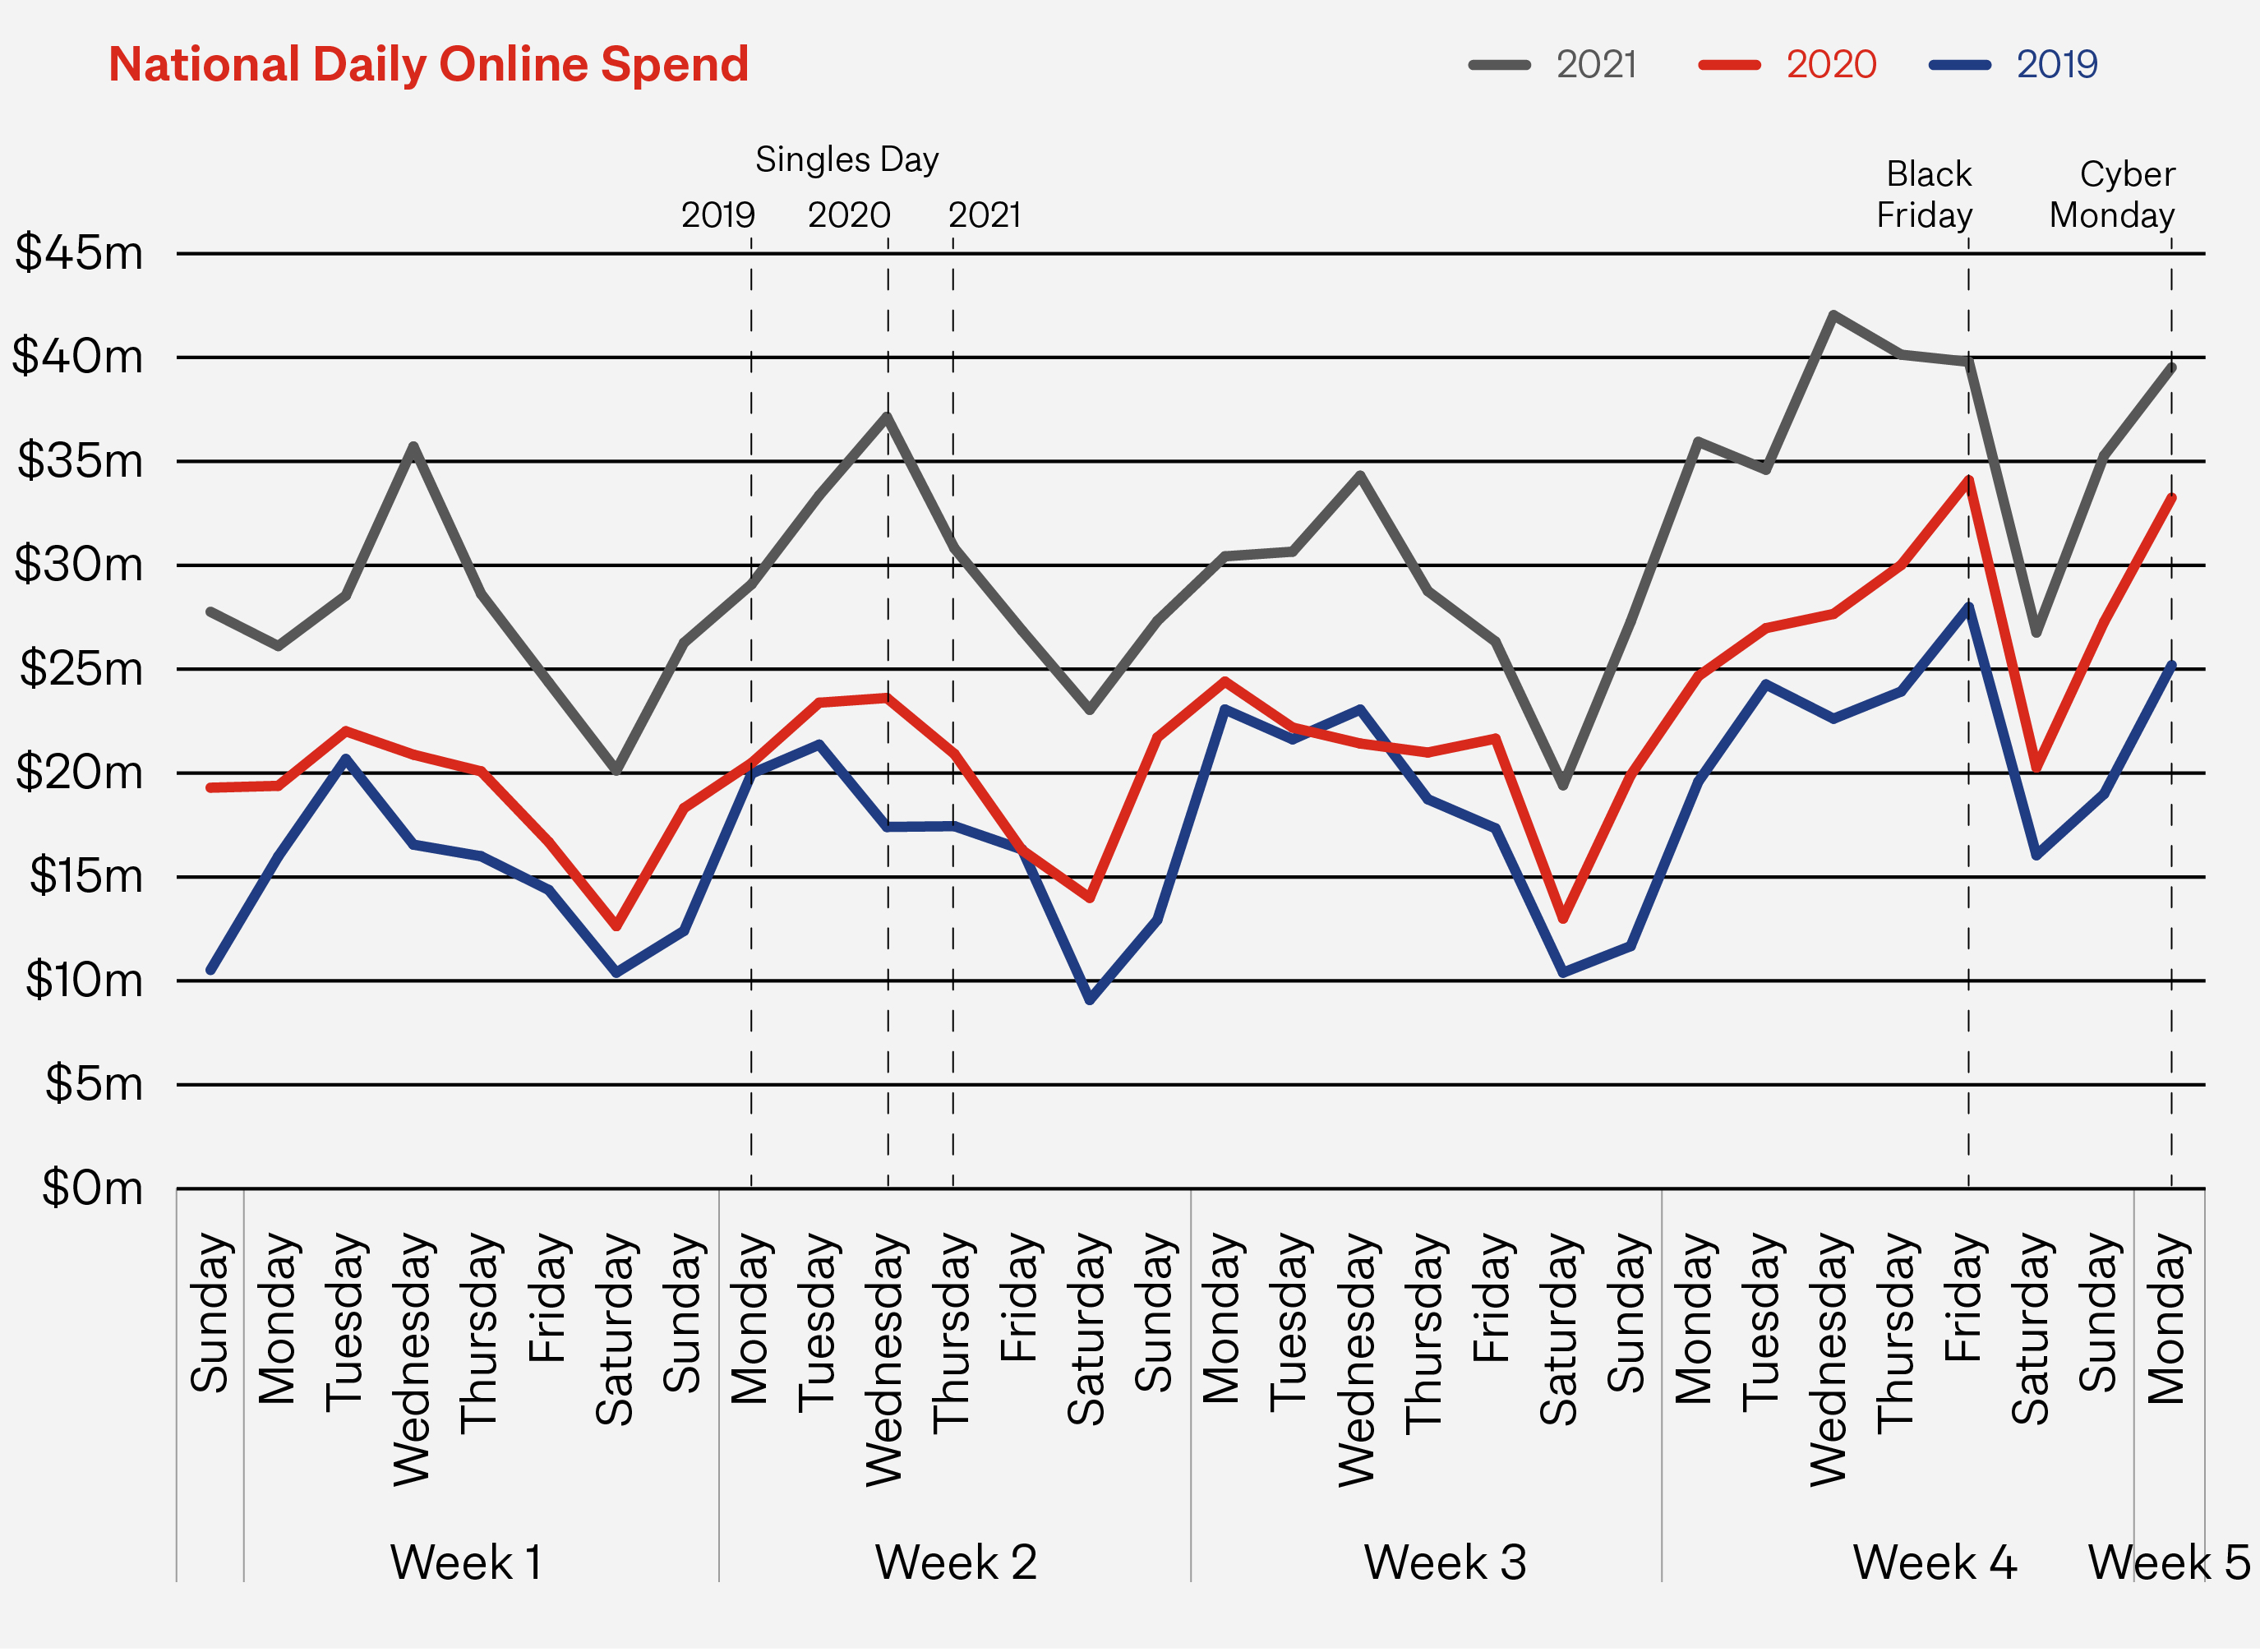
The biggest day of the month was Wednesday 24 November, two days prior to Black Friday, with over $42m spent in a day. The day before Black Friday also topped $40m while Black Friday itself was just below the $40m mark.
The big spend period has historically been the four-day weekend which spans Black Friday to Cyber Monday. This year, spending exceeded $141.3 million, up 23% compared to the same four days in 2020 and up 60% on 2019. These numbers were driven by over 1.1 million online purchases.
The reopening of Auckland retail
After months of restrictions on retail stores, on 10 November Auckland’s stores re-opened, albeit with masks and social distancing requirements. Online spend fell in the week that followed, as Aucklanders embraced the freedom of returning to the stores, but it rose again the following week as the Sales Events drove increasing daily spend.
Key November stats for Auckland:
- Auckland’s online spending was up 58% from November 2020 and over double that of November 2019.
- Growth was driven by a 69% increase in the number of online transactions compared to November 2020.
- Nearly 627,000 Aucklanders shopped online in November 2021. That’s 21% up on November 2020.
- Auckland shoppers made up 44% of New Zealand's total online spending in November 2021.
- The average Auckland shopper spent more money, and shopped more often, in November 2021 than the year before. They made 5.2 purchases online in November 2021 (up from 3.7 in 2020) and the average monthly spend was $625 – up $148 (31%) compared to November last year.
- Aucklanders embraced sales events to a greater extent than the rest of the country. Online spending over the Black Friday/Cyber Monday ‘four-day weekend’ reached $49 million, up 32% on the same period in 2020. New Zealand as a whole experienced 23% growth over that long weekend.
Driving towards a record year
November has always been a big online sales month with sales events and the start of Christmas promotions. Despite the volume challenges retailers faced in previous months we saw the eCommerce sector adapt and embrace the sales opportunity with great effect.
The new Covid Protection Framework (“the Traffic Light System”) has now seen more retail stores reopen and more shoppers, including Aucklanders, enjoying the in-store experience. And with Auckland’s borders also reopening in December, many Kiwis will get off their computers and out and about this month. Despite these newfound freedoms, we expect November’s online spending momentum to keep going in December, as Kiwis finalise Christmas presents and holiday plans.
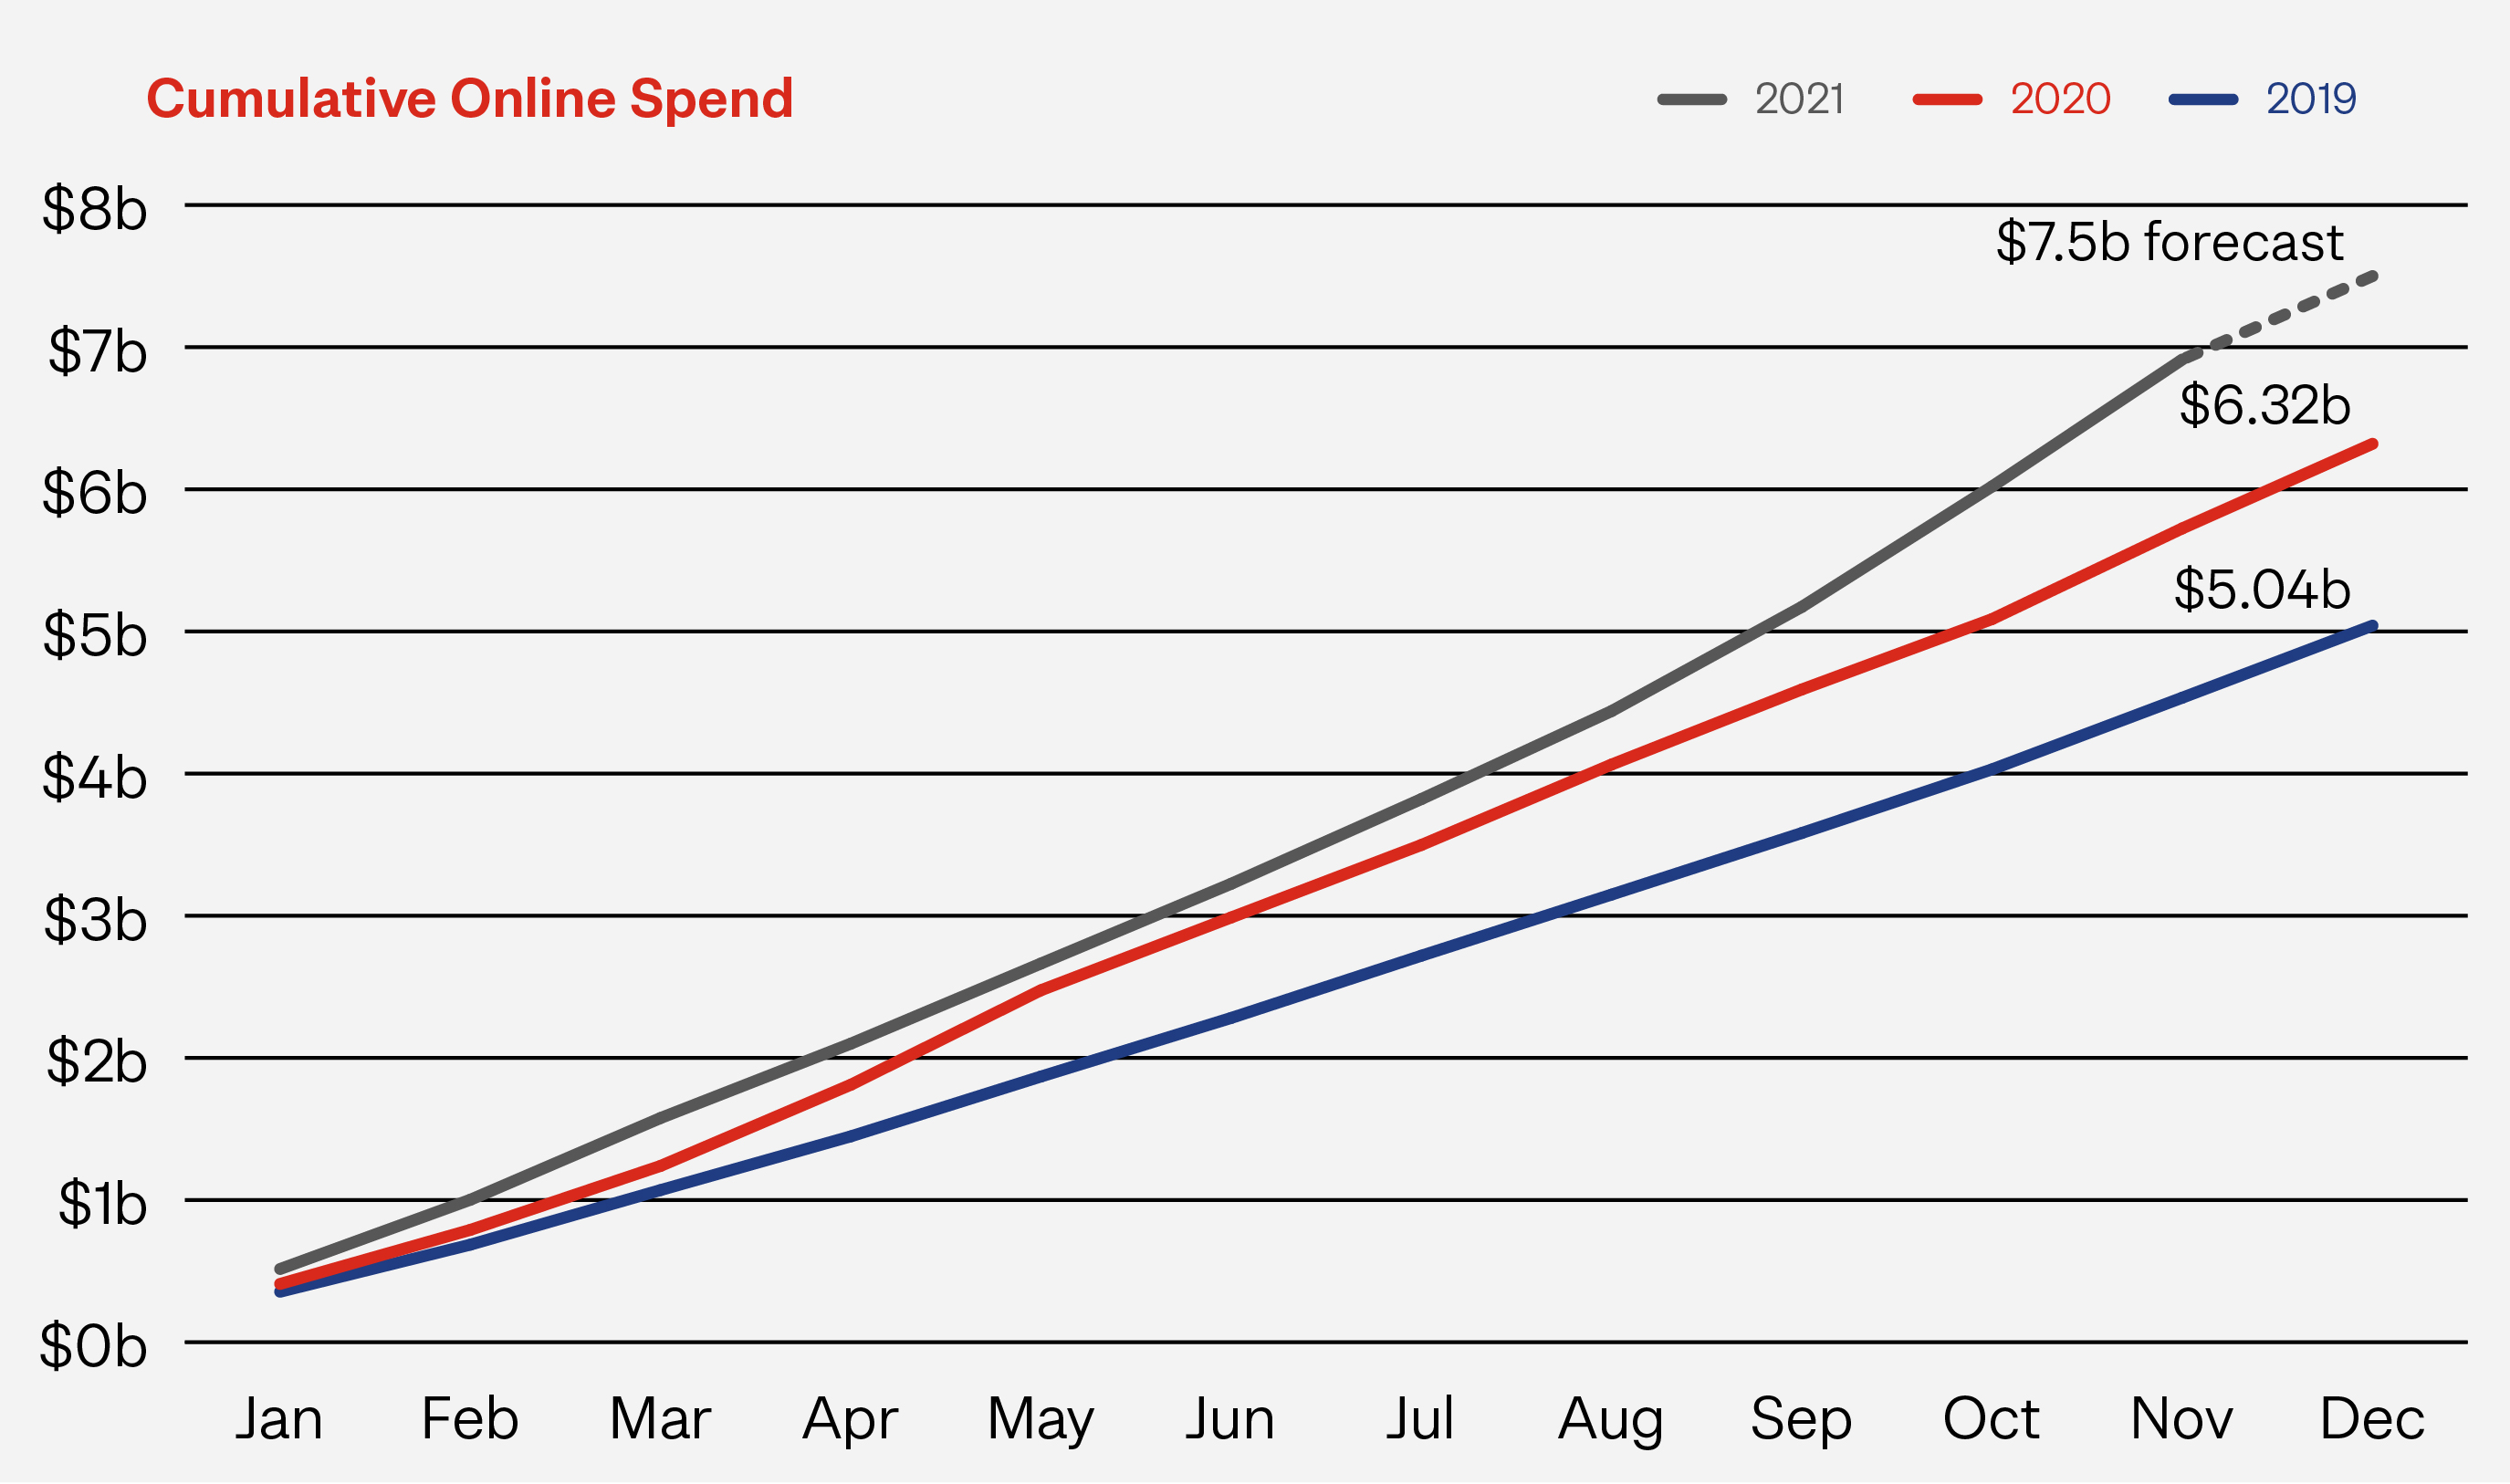
The year to date online spend of $6.9b is already over half-a-billion dollars above what 2020’s full year spend was. With a big December in the works we anticipate that annual online spending will exceed $7.5b for 2021 and potentially get to $7.7b and above. Even the conservative $7.5b number represents significant growth of over $1.2b and 20% on 2020, a year which was already over a billion dollars, and 25%, up on the year before.
The data used in this eCommerce Spotlight is based on anonymised card transactional data supplied by Datamine. We are continually reviewing and refining our methodology to bring our readers the most relevant and accurate information possible. At times, as we update our approach, this creates some discrepancies with previously published information. While we won’t go back and adjust earlier published information, when comparing current information with past periods we will always do so using a consistent like-for-like methodology.